7+1 Email Marketing Metrics to Track Email Marketing Success
Would you like to try email marketing but are not sure it will bring any positive return on investment?
Well, your question is valid, considering how many other marketing strategies are available right now. However, you’ll be surprised to find how much revenue email marketing alone brings on a yearly basis. Take a look at this graph:
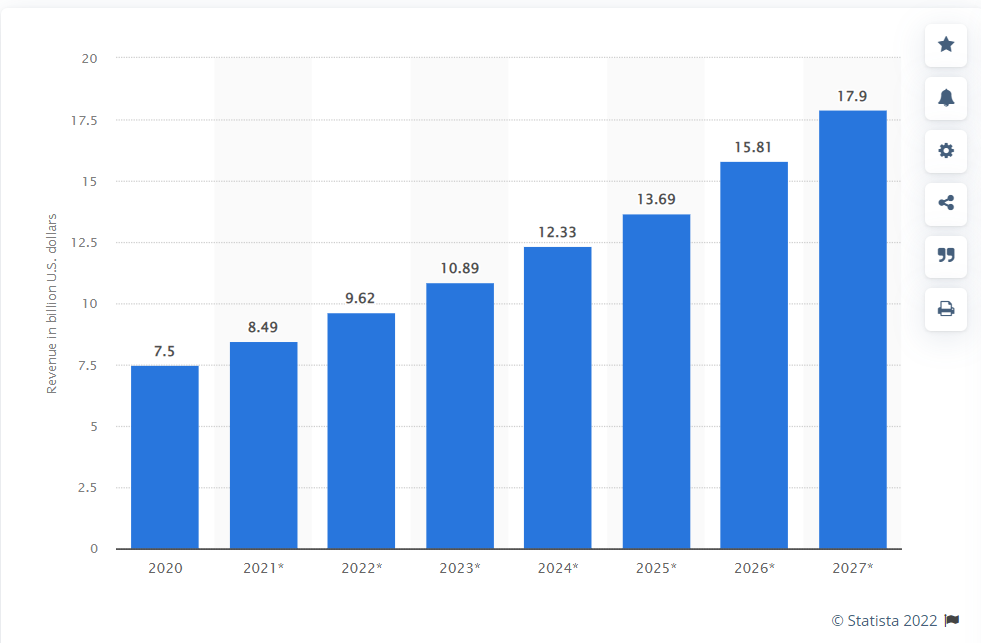
According to Statista’s projections, the revenue is expected to grow by at least $1.5 billion each year worldwide, so email marketing is very profitable. However, there’s one hitch – your campaign won’t bring any results if you don’t commit to tracking performance metrics.
Not sure which metrics to start with?
In this article, we’ve got the list of the most important ones, with a few tips and examples to help jump-start your strategy.
What are Email Marketing Metrics?
Email marketing metrics are key performance indicators (KPIs) that help you track, guide, and measure the progress of your email marketing campaign. The goal is to spot the gaps in your strategy and identify the tactics that will lead your efforts to success.
How many KPIs do you need to track?
There is no specific number, but it’s definitely more than a couple. Following one or two metrics can be informative, but it’s not enough to help you understand why your efforts are not bringing the results you expect.
For example, if you want to nurture leads with your email campaign, tracking just unsubscribe rates only gives you a vague idea of why people bounce: it could be an irrelevant offer, unengaging content, and hundreds of other reasons.
So, as with any other digital marketing strategy, the best way to define your metrics is to set your objectives first. Consider the SMART model for goal-setting – it helps you understand how all currently available resources answer your intentions.
Metric #1: Open Rate
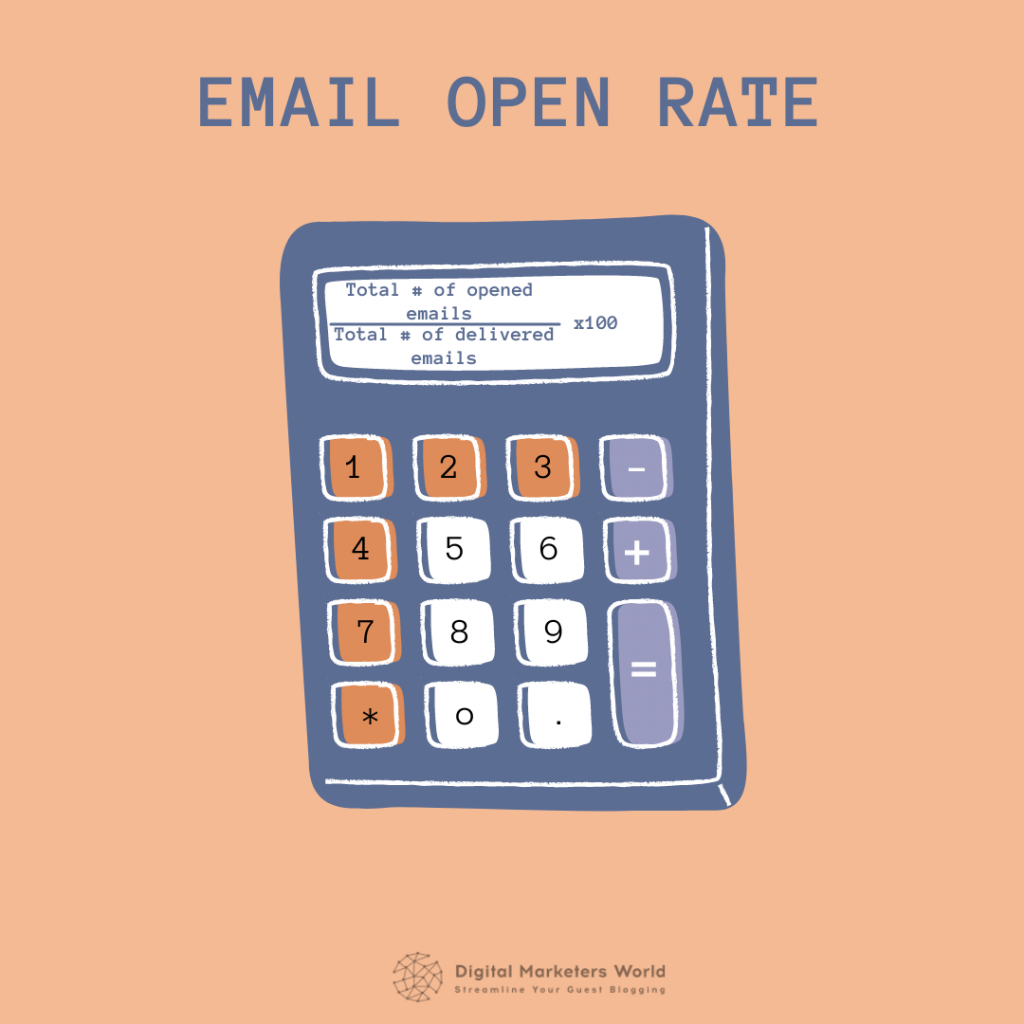
An email open rate equals the number of opened emails out of all the delivered ones. You can also refer to this metric as the percentage of subscribers who opened a specific message from all the subscribers who received it.
Here’s the formula to calculate the open rate:
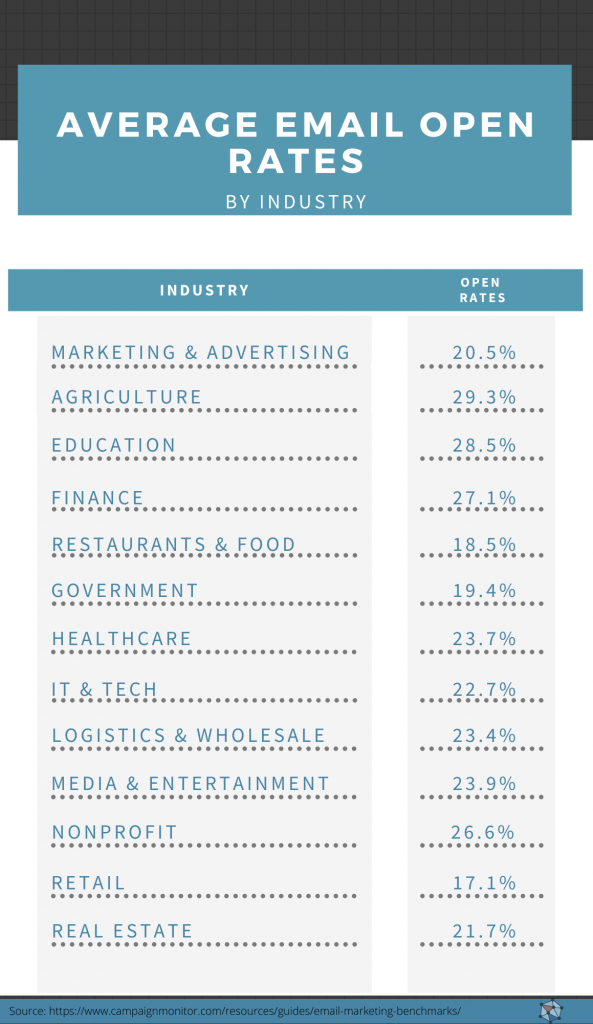
Note: the average percentage can differ drastically from industry to industry. For instance, according to the study by Campaign Monitor, an average open rate for hospitality businesses (20.2%) is 2% higher than the one for restaurants and other Food & Beverage ventures (18.5%), even though both are often considered as the same industry.
Here’s a complete list of open rates per industry based on Campaign Monitor’s report:
Now, what can cause this performance indicator to drop?
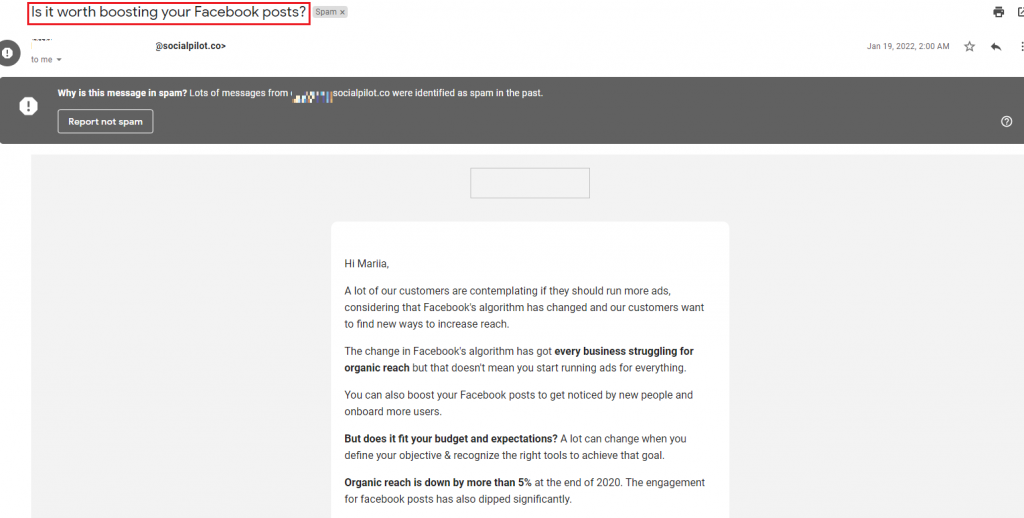
There could be many, but one of the most obvious is an unoptimized subject line that lacks personalization. Think about it – an office worker receives 121 emails a day on average. Would they want to open something that is irrelevant or even looks like spam?
That’s why it is super important to A/B test your emails before sending them. Even a seemingly harmless question in the subject line can throw your message right in the spam folder:
Another common reason for low open rates is a low-quality subscriber list. For instance, purchased lead lists often contain outdated data. As a result, you end up sending your messages to inactive accounts or people who don’t fall under your target audience description.
The same goes for your own subscriber list – giving it a thorough check at least once a quarter is vital for not just your open rates but other KPIs as well, such as unsubscribe rates, CTR, bounces, etc.
One more thing worth mentioning here: open rates are directly linked to the frequency with which you’re sending your emails. If you literally start bombarding your subscribers with messages, don’t expect them to open each and every one of them. At the same time, if you don’t send emails often enough, they will simply get lost in those 121 daily messages your subscribers receive on average.
What’s the solution?
Test, test, test, not just the subject lines, but the content and the frequency as well. You want your message to appear at the right time with the right offer on hand.
Metric #2: Click-Through Rate
Click-through rate is the percentage of people who clicked on a link, an image, or a CTA button in a specific email. This metric is a must to follow if you want to assess how engaging the email content is.
Here’s how you measure email CTR:
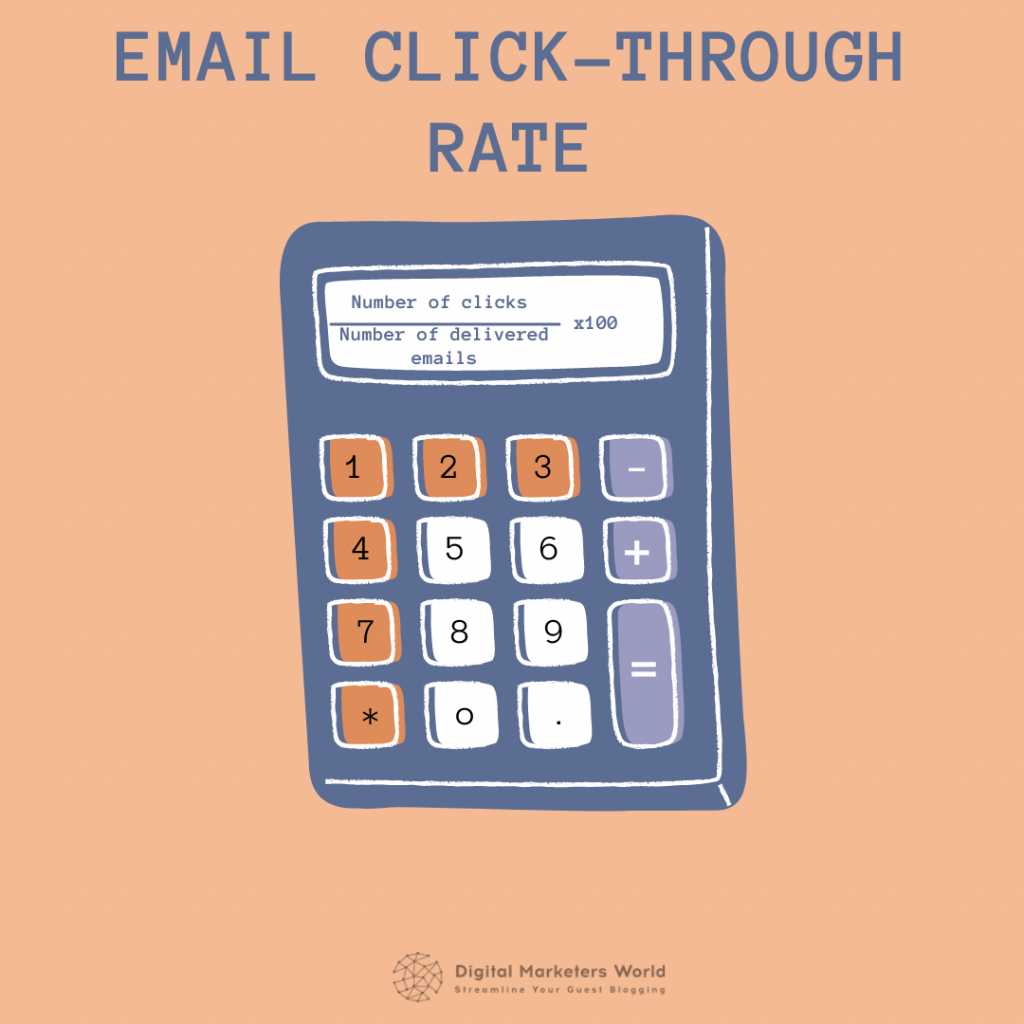
When measured over time (during several campaigns), this performance indicator helps you understand the overall interest of your subscribers in your emails. This data can help you identify the gaps in your email marketing strategy and work on fixing them in your future campaigns.
What is the average CTR you can use for reference?
There is no common ground on what can be considered an ideal CTR for everyone. For example, the Campaign Monitor report we mentioned earlier calculated the average percentage of 2.3%, while the Benchmark Email study offers 3.39% as a median number for all businesses.
So, much like with an open rate, it makes sense to look up what’s generally accepted in your industry and use that number as a reference point.
Interestingly enough, Benchmark Email also shares that CTRs can differ depending on the location. Take a look at the numbers for different regions:
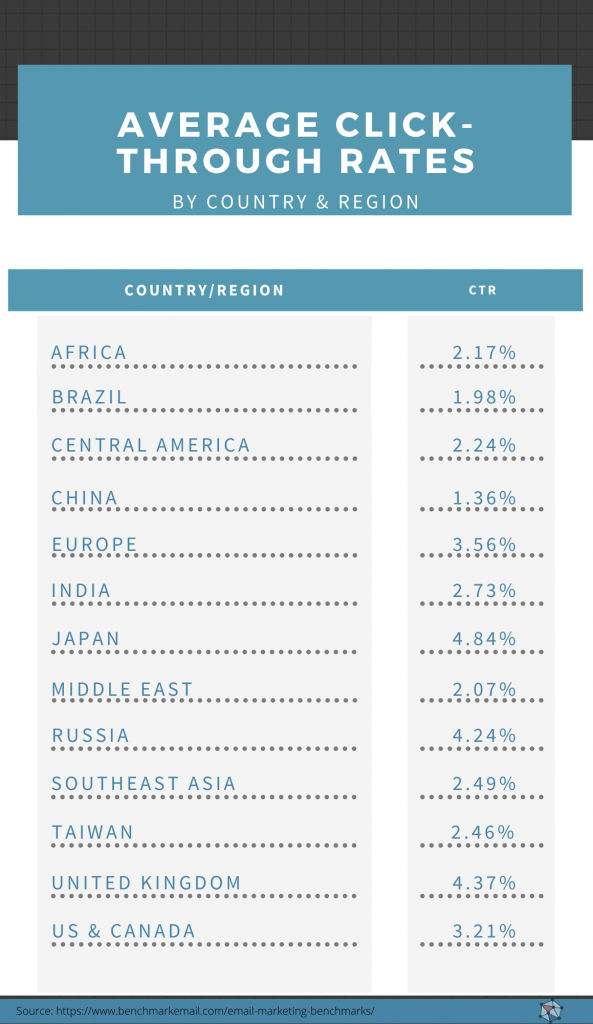
The reasons why the regional factor impacts email click-through rates can be different. For instance, the purchasing power of a consumer in Germany is far higher than in Mexico. So, if your e-commerce business is targeting people in these two countries, you can expect CTRs in Germany to be higher.
Is your click-through rate too low?
Most likely, your message doesn’t interest your subscribers. It either doesn’t offer anything relevant, or the content in the body of the email is not engaging enough.
Also, the position of the call-to-action button or link can affect click-through rates. Besides, it’s not always necessary to stuff your message with CTAs in an attempt to increase the likelihood of a purchase.
For instance, there is only one CTA button in the email below, and the main focus is on helping a subscriber make a well-informed purchase decision, not to sell at all costs:

In fact, using a single CTA is the optimal solution for good click-through rates. According to Wordstream, using only one call-to-action button increases the number of clicks by 371% and, going further, improves conversions by 1617%. Impressive, huh?
Metric #3: Conversion Rate
Conversion rate is the percentage of email recipients that performed a certain action. For instance, it can be a purchase, a subscription, free trial signup, etc.
So, as you can see, a conversion in email marketing doesn’t necessarily involve buying a product. Rather, it depends on the goal of your campaign.
The formula for calculating the conversion rate is very simple, take a look:
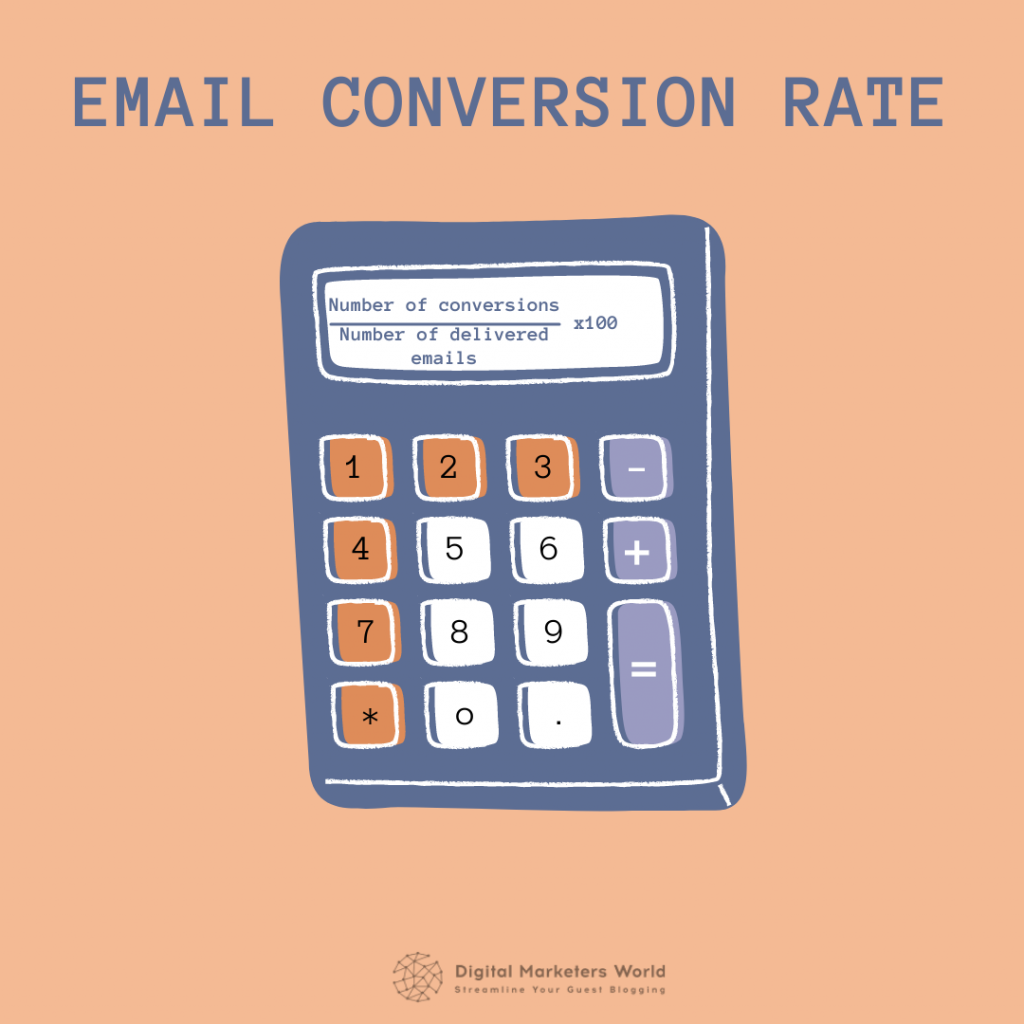
As it usually is, you won’t find a single ideal CR percentage. For instance, Barilliance said that 1.33% was the average email conversion rate in 2021. In the meantime, GetResponse offers to take 2.96% as a reference. So, consider the benchmarks for your industry before jumping to any conclusions.
Another factor you can consider is the campaign type that can help you increase conversions. The Barilliance report we mentioned in the previous paragraph investigated three types of cart abandonment campaigns and drew CR averages based on their performance:
- 24.58% for campaigns involving messages to potential buyers who placed an item in a cart but didn’t buy it.
- 18.54% for campaigns with emails sent to consumers who filled in the purchase form but didn’t pay for the item.
- 2.10% for campaigns involving prospects who browsed a product list but didn’t add anything to their carts.
As you can see, if your goal is to reduce abandoned carts, you can take different approaches to tackle this task. By the way, you can look up inspiring email examples for this campaign type in our article.
Finally, the question that probably interests you the most right now – how to optimize low conversion rates?
Take a look at your CTA – it may be a bit off. If you want to convert a customer, you need to tell them specifically what action you want them to take. Besides, your CTA should be a natural conclusion of the message you’re trying to deliver with your email.
Here’s a good email example from Under Armour of how it should be done:
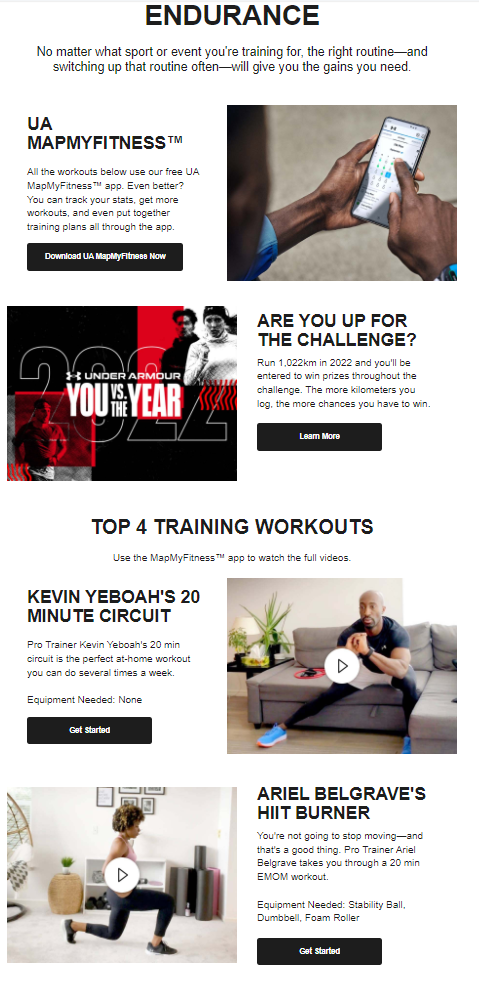
As you can see, there is a separate call-to-action for each individual offer in an email. For example, after introducing the at-home workout program, it makes sense to end it with the Get Started button to invite the subscriber to proceed.
So, if you want a prospect to convert, make an appealing offer and then guide them to the next sales funnel stage with a natural CTA.
Metric #4: Bounce Rate
Email bounce rate is the percentage of messages that were not delivered to the recipients out of the total number of emails. So, essentially, this metric reflects the email deliverability rate.
We already covered everything related to this metric in our email bounce rate article, so let’s briefly recap the most important points.
You can calculate the bounce rate using the following formula:
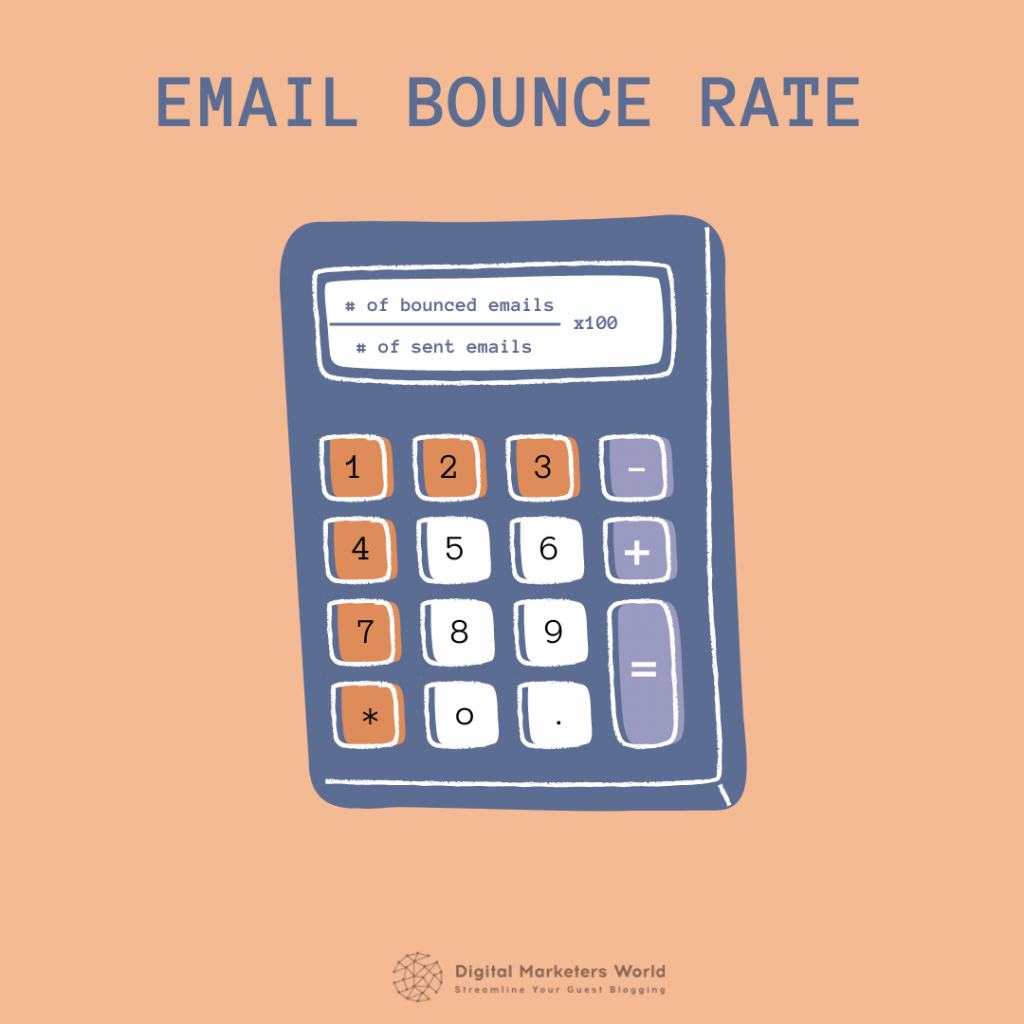
It’s also worth mentioning that there are two types of bounces – hard and soft. A hard bounce means your email was not accepted by the recipient’s email server. In its turn, a soft bounce happens when the server lets your message through, but it still returns back.
What is a good bounce rate?
Again, there is no ideal percentage, but Mailchimp recommends sticking to 2% or less. You can look up the data for your industry in the graph in our above-mentioned article.
Why can email bounce rates go up?
Here, we need to differentiate between hard and soft bounces.
For instance, when it comes to a hard bounce, it can happen if the email domain is outdated or no longer exists. Also, an email service provider can block your IP, especially if your sender reputation is bad.
With soft bounces, the scope of reasons is broader:
- The target mailbox is no longer active
- Recipient’s server is not working
- Your message is blocked by anti-spam or received too many spam complaints
- The recipient’s inbox is full
There is one common reason causing both types of email bounces – a bad prospect list. Whether you purchased one for lead generation or haven’t updated your own account list in a while, if it doesn’t contain valid contacts, you can end up with a bounce.
But here’s the main problem – if you proceed with targeting invalid email accounts, it can result in a high complaint rate and a bad sender reputation and a hard bounce, which is unfixable. So, watch your subscriber list closely – a high bounce rate can not only hurt your current strategy but all your future email marketing campaigns in general.
Metric #5: Email Sharing Rate
Email sharing rate shows the number of times a recipient clicked on the ‘Share’ button in your email and posted it on social media. This metric is also related to the forwarding rate, where a recipient shares your message with someone else via the ‘Forward’ button.
Here’s how to calculate this KPI:
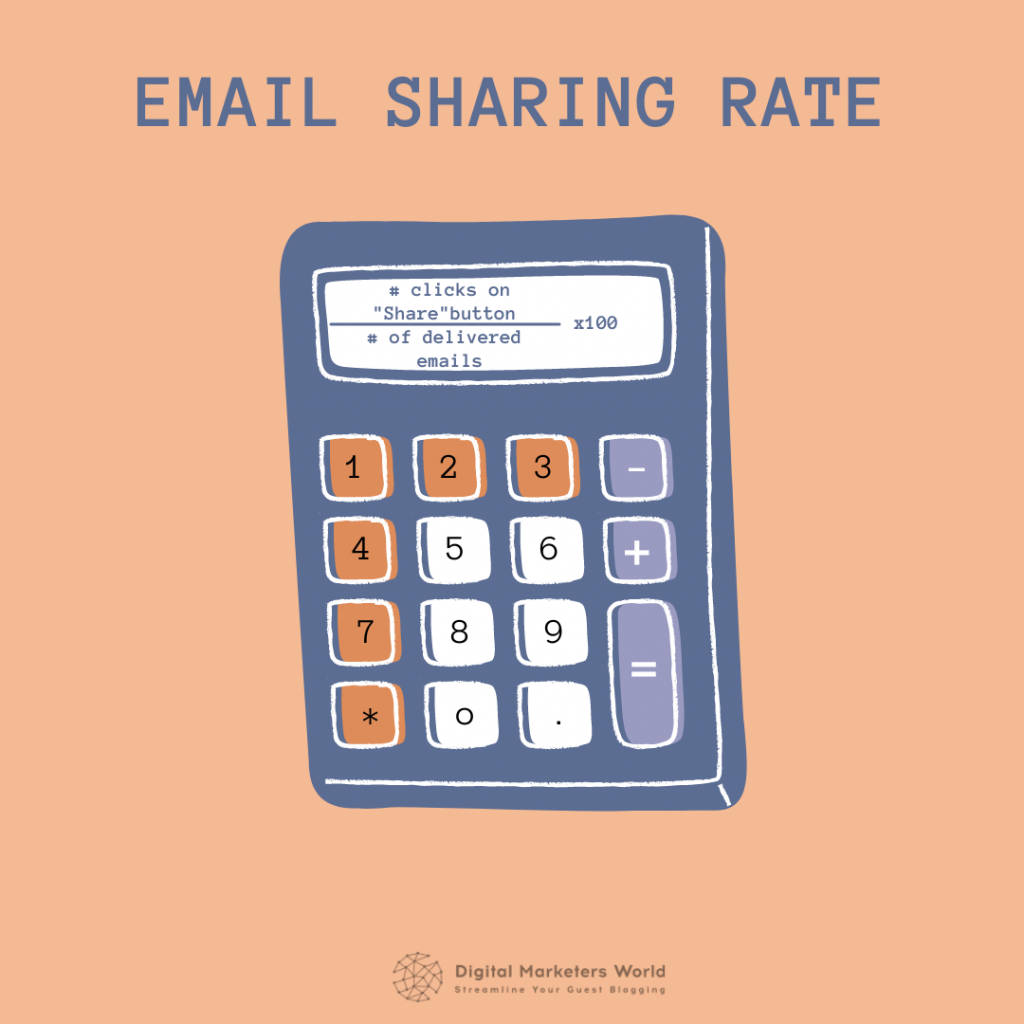
You might be wondering – why is the email sharing rate on our list? It doesn’t seem that important when compared to conversion rates, for instance.
Well, it might look like that, but this KPI actually helps you generate new email clients. Indeed, conversions are essential for your business, but so is growing your email list.
Additionally, you can also use this metric to measure email engagement. For instance, if the email sharing rate goes up for your newsletter with a recently published article, it means people see the value in it.
Obviously, not every email needs a ‘Share’ button; you don’t want it to look out of place. But,if you’re going to invite your subscribers for a webinar and want to increase attendance, you can place this button at the bottom of the email, as MarketingProfs did in their message below:
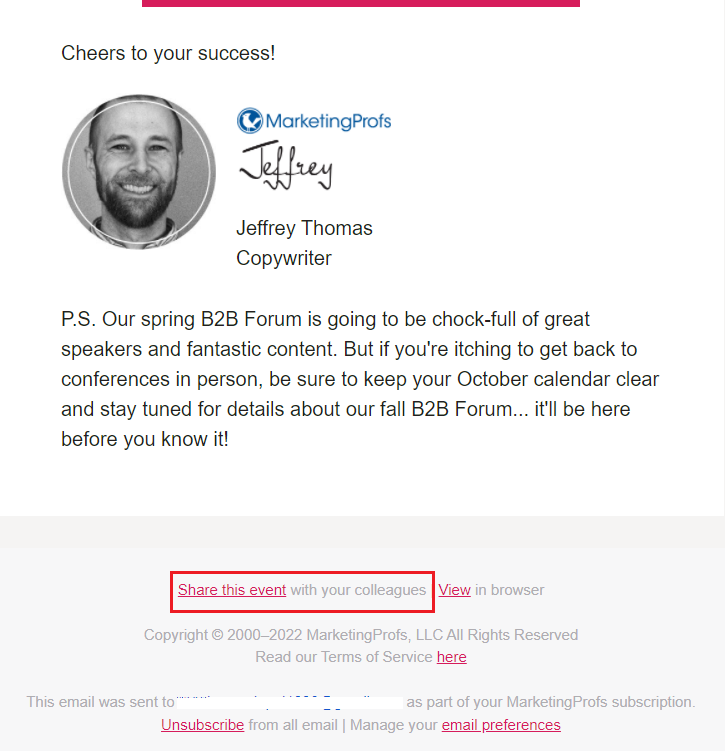
Emails with events, news, and important updates are naturally shareable – they carry something of immediate value, that’s why the recipients will be more likely to spread the word.
But what about other cases? What can you do to improve sharing rates?
Personalization is always a good solution, especially if you want your email subscribers to refer you to their friends. So, pay attention to segmenting your email list and focusing your offers on each particular segment.
Note that, although necessary in general, first name personalization alone won’t do the trick here. You want to offer something unique that a recipient and their inner circle won’t be able to say no to. Looking through any behavioral data will help you specify what they might need.
Metric #6: Unsubscribe Rate
Unsubscribe rate shows you the percentage of your subscribers who’ve decided to opt out of receiving your messages.
You can also interpret this metric with regard to a specific email campaign. In this case, the percentage will show the number of people who’ve unsubscribed from the messages that belong to the campaign out of all the subscribers who received these emails.
Calculating the unsubscribe rate is actually pretty simple:
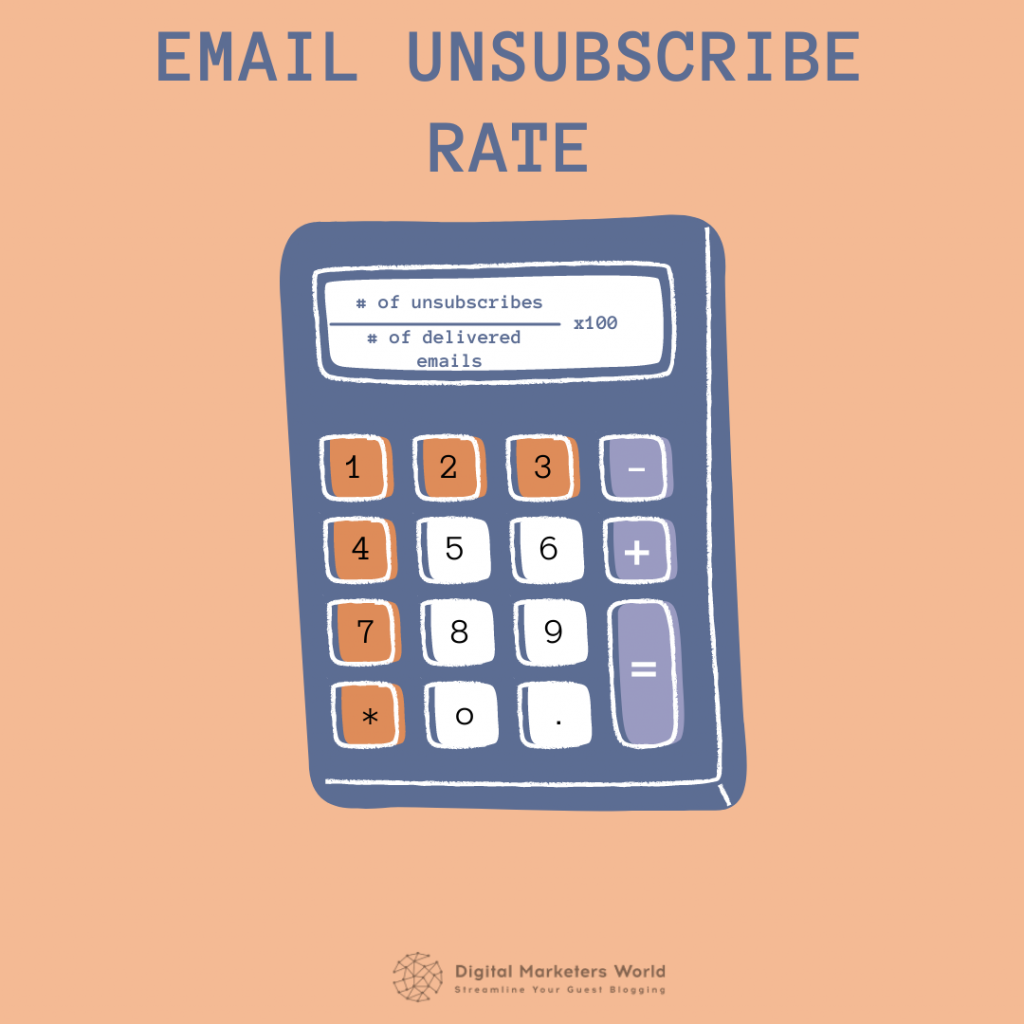
Now, what is a bad unsubscribe rate?
The study by Campaign Monitor that we mentioned when discussing open rates reports that the unsubscribe rate should not be higher than 0.1%. Indeed, for most industries, the averages stay between 0.1% and 0.4%. Here’s a graph for you outlining this metric for each sector:
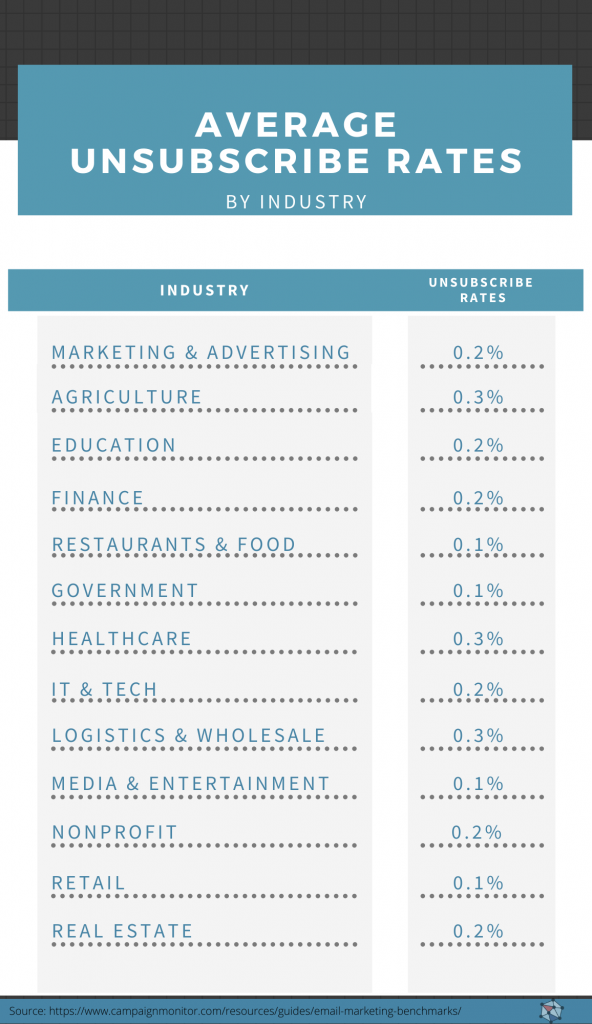
It might be a bit scary to check your unsubscribe rates, but they don’t always indicate that something terrible is happening with your campaign. Sometimes, a number of unsubscribes can come from irrelevant email accounts and prospects who are not interested in your brand. In this case, you just dodge the bullet.
If the unsubscribe rate remains too high, it can happen for a variety of reasons:
- No option for double opt in
- Improper email segmentation
- Poorly optimized content
- Over-spamming the subscriber’s inbox
- Low-quality email list
However, the reasons can be far simpler than those listed above. For example, a reason for mass opt-outs can come from small changes to your campaign. If you’ve recently changed the date and time of your mailout, it can cause people to unsubscribe from you, much like if you choose the wrong time to post on Twitter or any other social media marketing channel.
Metric #7 Mailing List Growth Rate
Email list growth rate is the metric that helps you understand the pace with which you’re acquiring new subscribers.
Calculating this KPI is actually very easy, take a look:
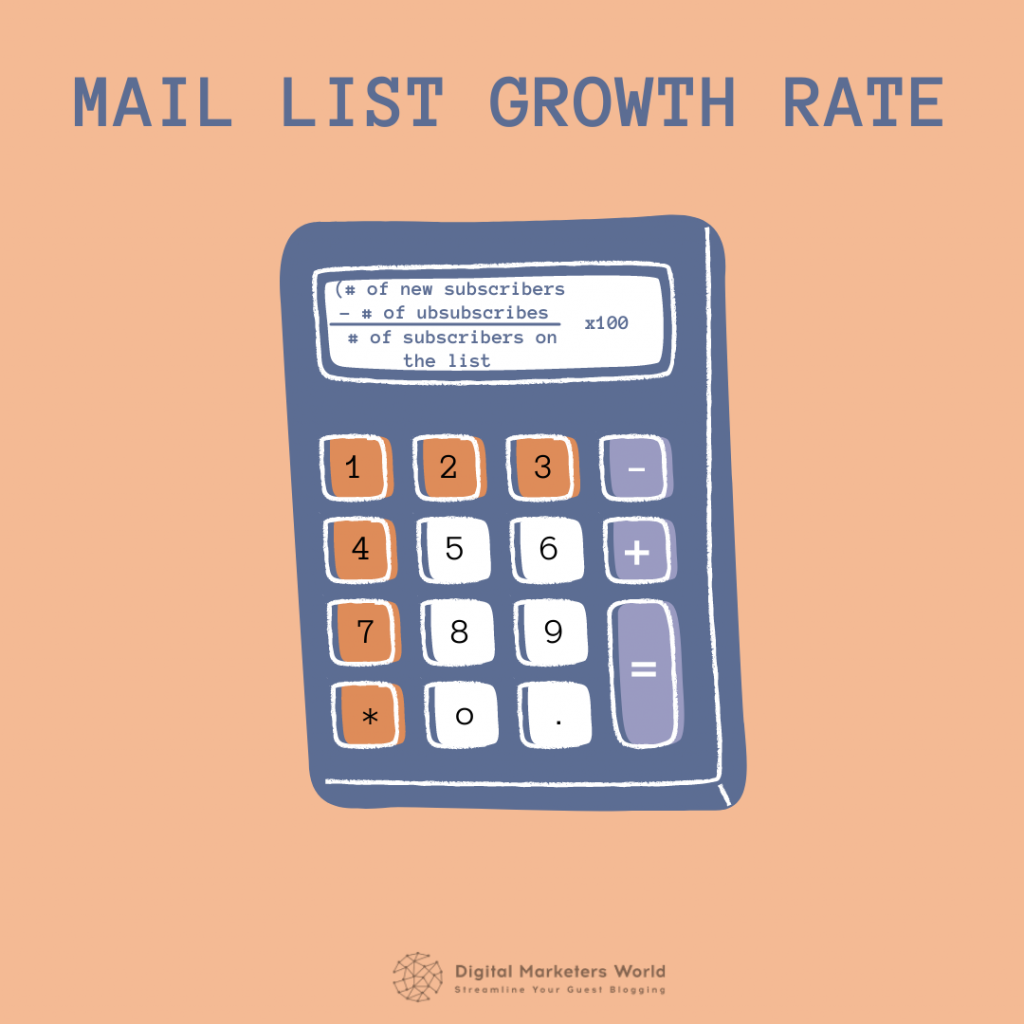
If you’re wondering, what is the optimal list growth rate you should follow, there is no definitive answer to that. Back in 2005, MarketingSherpa shared that the average number was around 40%, which is definitely way higher now, considering the ever-growing impact of email marketing.
So, what should you use as a reference?
Consistency. If unsubscriptions overshadow the email growth rate, you need to think about what you’re doing wrong that drives people away from you instead of luring them in. It can be low-quality content, irrelevant offers, poor segmentation, and a myriad of other reasons.
However, don’t panic right away if you see a slight decrease in your mailing list growth rate. According to HubSpot, all email databases degrade by around 22.5% every year. It means that it’s natural for your email list to expire. So, be mindful of this KPI but take the results with a grain of salt and always compare it with other performance metrics.
Bonus Metric: Overall ROI
Let’s finish the list of our email metrics with email ROI – the KPI that evaluates the deliverability, profitability, and, thus, the effectiveness of your email campaigns.
ROI is a standard metric in marketing and is calculated using the following formula:
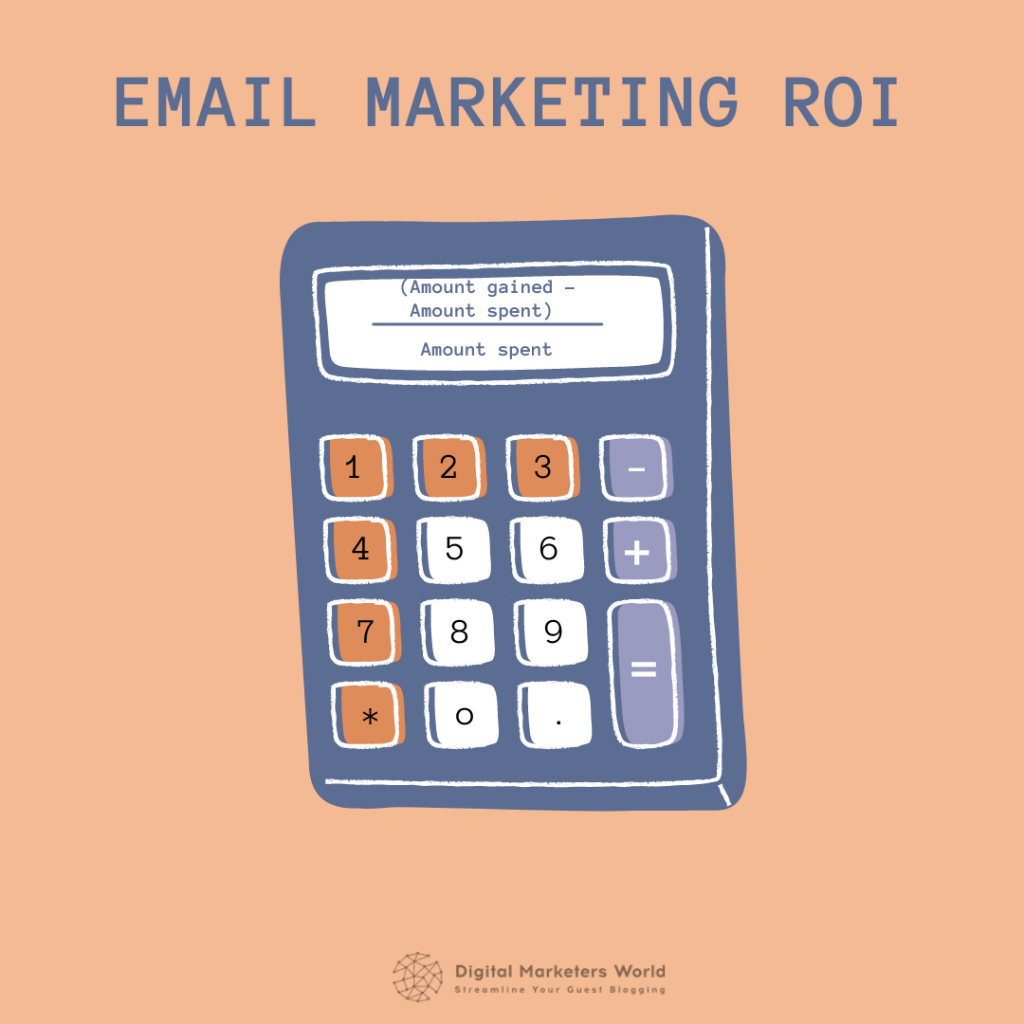
If it’s your first time trying email marketing, then you might be wondering what the average return on investment is for this strategy. The reality will defy your expectations – email marketing has a 4,200% ROI, which means it brings $42 for each dollar you invest in it. Pretty good, right?
Now, being one of the important email marketing metrics, return on investment is closely connected with the goal you’re trying to achieve with your campaign, be it lead nurturing, brand awareness, conversions, etc. So, to understand whether there is an actual positive result, you need to be well aware of your spend and gain.
Understanding your investment in the campaign involves the following:
- ESP (email service provider) and ISP (internet service provider) expenses
- Spending on email analytics and marketing automation tools
- Expenditures on the work of each team member involved in the email campaign
Next, you need to calculate your gain. It’s pretty easy to do if your email service provider integrates with automation platforms like Google Analytics. This way, you can just log in to see, for example, how many website visits you’ve got from marketing emails (if your goal is to increase traffic).
The integration with Google Analytics also allows you to trace down every conversion generated by your email campaign, whether it came from a desktop or a mobile device, and then multiply these conversions by the value of each lead. This is the gain from your email marketing efforts.
Now Over to You
The deliverability rate of your email campaigns is a very fluid notion. That’s why you need the metrics we introduced to you in this article to understand when the changes in the email performance happened, why they occurred, and what you can do to improve them or fix the issues they caused.
Let’s recap all the KPIs we discussed along with their definitions:
- Email open rate is the number of unique opens out of the general number of delivered messages.
- Click-through rate (click rate) is the percentage of people who clicked on a link or an image in a specific email.
- Conversion rate is a percentage of subscribers who performed a certain action out of all people who received a specific message.
- Bounce rate is the percentage of emails that didn’t reach the addressee and returned back to the sender.
- Email sharing rate reflects the percentage of recipients who’ve clicked on the ‘Share’ button in your email.
- Unsubscribe rate shows the number of people who opted out of receiving your messages.
- Mailing list growth rate reflects the pace with which you’re acquiring new contacts to your list of subscribers.
- Email marketing ROI shows whether your investment in email strategy brings results or not.
There is no point in tracking just one or two of these KPIs. Actually,including the majority of these metrics will help you gain a more profound understanding of your campaign’s performance.
If you’re interested in more articles about using email marketing in campaigns to generate sales, read our article on email retargeting – it shares the most useful, up-to-date practices to help you increase conversion rates and improve customer loyalty.
Frequently Asked Questions (FAQs)
In conclusion, let’s wrap up with a few common questions regarding the metrics that help you assess the effectiveness of your email marketing efforts.
Q1. Is there a formula to calculate email open rate?
You can determine your email open rates by dividing the total unique opens by the total number of recipients and multiplying the result by 100.
Q2. What’s the difference between email open rate and email click-through rate?
Open rates reflect the number of recipients who actually opened your email. Meanwhile, click-through rates show how many recipients clicked on the link, an image, or a CTA inside your email.
Q3. How is email marketing measured?
The overall success of your email marketing efforts is measured through return on investment – a metric that shows whether your spending on this strategy is viable. Conversions also play an important role here – this metric can be adjusted according to the goal of your campaign and shows how many people performed the desired action (sign up, purchase a product, and so on).
Q4. What are KPIs in email marketing?
Key performance indicators help assess the campaign performance, progress, and results. The KPIs should be selected based on the goal of your campaign.

Mariia is a content strategist and editor at Digital Marketer’s World. She is passionate about educating others on all things marketing and believes in the power of the written word.
